Framing Effect
RTP, or '(the) return to player', is an often argued and misapplied metric in games of chance/wager, because it serves one purpose: it makes a high house edge game visibly look less terrifying than it really is. That's the simple way to go about it, assuming that RTP itself is a tool to inflict the often ignored (or pridefully assumed to be ineffective) Framing Bias), a cognitive bias "where people's decisions change depending on how options or statements are framed, even when they are logically identical".
The Fundamentals
Defining RTP as Inversed House Edge
That's going a little off course of the intention of this short essay, however. To refocus, I want to define 'RTP' as I will be discussing it in this paper. To be clear, RTP is very easy to define at its most base form, as it's a kind of framing effect: RTP is simply 1 - house_edge%. So, the inverse is: house edge is 1 - RTP%.
Definition 1: RTP is 1 minus the house edge, as a percentage. If the house edge is negative, then the RTP will be above 100%. This is commonly called Player Edge.
If the house edge of a game is 4%, then the RTP is 1 - 4% = 0.96 = 96%.
Because we have added this as a way to manipulate the simple mathematics behind chance-based metrics, we can expand on that a little bit by using it in new ways that house edge was less effective at. We can try to do some different methods for extracting some sort of information out of this value that may relate to our wager or play.
RTP vs. House Edge as defining return or loss
Definition 2: RTP is the difference between your total wager and your expected return.
For example: over $100 of wager/played through balance, at 96% RTP, we will on average receive $96 back in return.
Instead of looking at our total balance and expecting a certain value, it's informing us of our expected return, which has to be compared with our loss. Loss is equivalent to wager. Profit is return minus wager. Negative profit is possible. If you were returned $96, and wagered $100, you are -$4 in total.
The amount you started with is irrelevant here; if you had $4, you now have $0. If you had $100, then you have $96. If you had $10000000, you have $9999996 now.
House edge tells us that: over $100 of wager/played through balance, at 4% house edge, we will on average lose 4% of our wager, which is 100 * 0.04, or $4. Thus, if you had $100, then you now have $96.
The two are the same result, but approached in opposite manners. So, how can we use these two different methods for framing loss in gambling?
You can watch this example play out below. This is a mini version of my Return Over Time calculator: $1 bets at a 50% win chance, with the RTP and bet count adjustable.
Volatility as a function of variance
However, as anyone who has played a game of chance knows, we do not end up perfectly following RTP or the house edge on every game we play. Now, it can sometimes end up surprisingly close. But the variable that impacts this time until equilibrium is what I would call volatility.
A game with high volatility takes longer on average to reach the equilibrium point where it settles at its resting RTP.
A game with low volatility takes a shorter amount of time to reach this point. Once a game has reached that point, it becomes very difficult to deviate from it.
But how do we find out if we have reached that point of equilibrium?
Defining RTP as a 'metric of efficiency'
Consider 100% RTP like a straight line.

Volatility will take you different places, but eventually, you will average out to having lost no money. How long that takes, again, is dependent on the volatility metric.
Its slope (how diagonal it is) is based on the RTP/edge value. Because a vertical drop would be 0% RTP (as you never gain any return on that), and a vertical line is 90°, we can define 1% of edge as being 0.9° of downward slope.
4% edge would look like this:

As the slope goes down. If it went up instead, then your expected profit would be $4. But only the house gets to see the opposite way; otherwise, they would lose all of their money, very quickly.
We can then overlay 'volatility'. We can also easily define the concept of luck in this way: as luck is relative to the observer, luck is a measure of beneficial volatility for the observer.
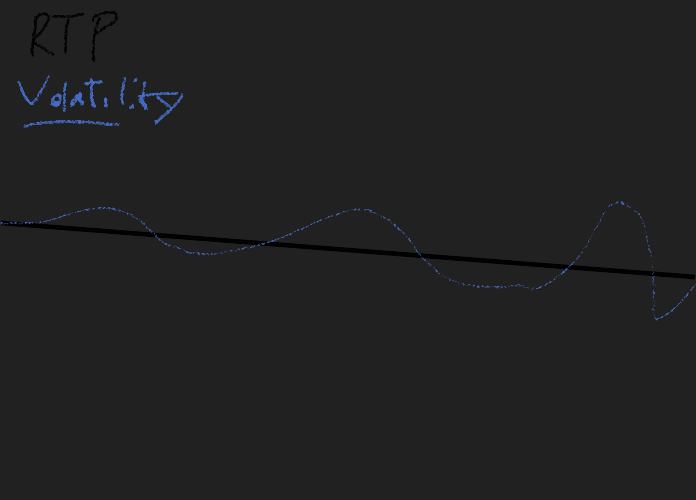
Using statistical methods of analysis, you can also calculate the severity of the volatility, by calculating the standard deviation and variance of a sample set. Even Pythagoras has a place here.
Defining RTP as fate
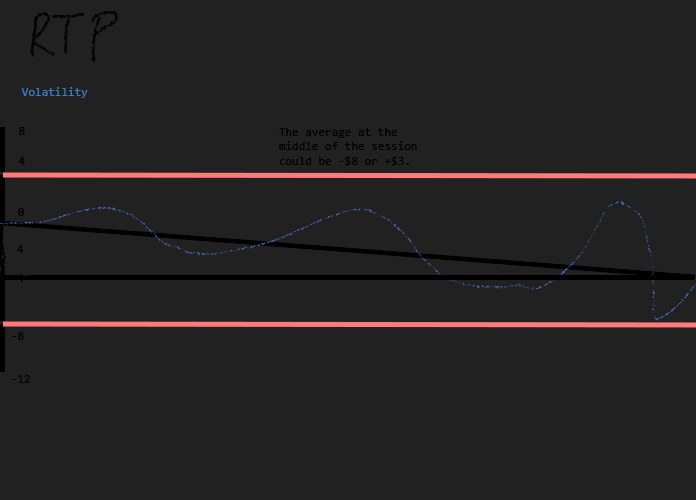
Now, hold on a second: what's with this chart? Why is it so much easier to go to -12 than to +8?
Logically, we would assume the difficulty of reaching +12 or -12 to be roughly the same. However, that's not true when RTP is below 100%, or house edge is above 0%.
That's because your 0 point is continually moving downwards with you. Take the $100 at 4% edge example: halfway through the wager, your baseline is no longer 0; it's now -2. To reach +2 now takes twice the difficulty it did before, and to reach -4 takes half. No matter how well you do, so long as the house edge stays consistent and does not vary (which is only reliant on staying on the same game or same expected house edge), your baseline will always lower as you play more. The only way to raise the baseline is to add to your original amount from an external source, e.g., deposit. However, that's a temporary boost, and does not actually resolve this issue of the sinking ship.
Bet size/wager size affects the range of volatility, but not the volatility itself, per se. The volatility is considered as a percentage of the average, and not a linear value. So these effects are occurring no matter what, how, or why you bet: so long as the house edge is above 0%, you are slowly sinking. You can hit a huge win or profit, and end up playing long enough to bring that average all the way down to how much you won.
Definition 3: RTP is a fixed line of bearing from the origin point to the expected end point of any session.
Game RTP
A game's RTP is simply the inverse of the house edge, as listed before. How does a game arrive at that house edge? Typically, it's a mathematical result of the behavior between the given returns in a game and the probabilities of those returns: each return multiplied by its probability gives the expected value of that result, and the summation of all of those products together equals the RTP. Sometimes it is really hard to do this, or hard to prove that it's true. As a simple example, I will include the PAR sheet of my game uwu777, currently a work in progress.
The uwu777 PAR sheet
uwu777 ('UwU 7s') is a 1x3 slot: three reels, one row, sixty symbols per reel strip. Symbols are either eyes (o u < > ^ ♡) or mouths (w v ~ ♡), and a spin pays when the three stops form a complete eye-mouth-eye face.
The base game reel strips (count per 60 stops on each reel):
| Symbol | Reel 1 | Reel 2 | Reel 3 |
|---|---|---|---|
| o | 7 | 6 | 8 |
| u | 7 | 4 | 9 |
| < | 9 | 3 | 6 |
| > | 7 | 3 | 7 |
| ^ | 8 | 4 | 6 |
| w | 8 | 15 | 9 |
| v | 7 | 13 | 6 |
| ~ | 5 | 7 | 5 |
| ♡ | 2 | 5 | 4 |
The pay rules:
| Face | Pays |
|---|---|
| ♡♡♡ | 25x |
| ♡ eyes with any mouth | 5.8x |
| any two hearts | 2.9x |
| heart mouth (e.g. o♡o) | 1.5x |
| < > side-eye pair | 1.5x |
| matching non-u eyes (e.g. owo) | 1.1x |
| uwu, uvu... | 0.5x |
| any other complete face | 0.2x |
| incomplete face | 0 |
Because every reel stop is equally likely, the probability of each pay is just the product of the three symbol frequencies, and we can enumerate every combination exactly:
| Outcome | Probability | EV contribution |
|---|---|---|
| incomplete face | 70.3704% | 0 |
| 0.2x | 19.7199% | 0.039440 |
| 0.5x | 1.0208% | 0.005104 |
| 1.1x | 3.3542% | 0.036896 |
| 1.5x | 4.8681% | 0.073021 |
| 2.9x | 0.5185% | 0.015037 |
| 5.8x | 0.1296% | 0.007519 |
| 25x | 0.0185% | 0.004630 |
| base spin total | 0.181646x |
Two or more hearts trigger 5 free spins, which lands once in every 98.2 spins on these strips. The free game uses hotter reel strips (15/14/16 hearts per reel) worth 0.9807x per spin by the same enumeration, plus a charged multiplier on the final spin. The target RTP is 97% with a 100x win cap; the remaining distance between the base reels' 0.18x and that target is carried by the bonus and by the engine's outcome weighting. The current work-in-progress build simulates at 96.64% with a 75.05% hit rate.
Note that at no point did we need to spin this game even once to state its exact base-game probabilities: the pay table and the reel strips are the RTP. The simulation only checks that the assertion holds.
To prove their calculations are correct, most slot providers are expected to run some huge number of spins in order to verify and prove in a practical sense that their game achieves an expected consistency rating. A game that is too volatile is rarely allowed to be published. As the usual amount is something like 100 billion spins, by conventional expectations, that means any probable result that would exceed that value is effectively banned from being included in the game.
This is usually what people think about when they think about pure RTP as a concept, and I think it can be hard to divorce ourselves from this idea that it's purely based on those billions of spins. In my framework, those spins are a proof of concept of the claimed RTP; not an answer to a question, but rather evidence of an assertion. It still doesn't prove much, because unless you do those spins yourself, that many is very difficult and lengthy to do without API access and backend simulator usage.
Definition 4, conventionally, is: RTP is the expected return rate over some n million plays of a game of chance.
*A corrected Definition 4, in my perspective, would be: RTP is a metric of the behavior of the relationship between a pay table + the probabilities of a game, and the summation of those variables as a unified value of measurement, used to rate the expected return or loss rate of any game of chance.*
We can take ANY game and rate RTP in this way, without ever doing 500 billion spins, as if you will recall, that is to validate/verify the math is correct as written and that it is within a realm of possibility and not beyond an acceptable player experience threshold. No one wants to play a game where the top win is impossible. Even Keno 10/10 is feasible. A game that would deviate from its expected RTP over billions of spins is an unseemly and horribly volatile experience that likely goes deep into loss before any win. Rarely does a game function the other way (except, of course, the martingale bet strategy, which uses that as a method for strategy in the short term, by creating easy, but expensive, guaranteed wins, and one loss condition which is will-shattering).
Using wager as a function of RTP (Player RTP)
Some websites use this formula to enumerate a specific player's RTP and to use it as a metric of efficiency + a statistic for bonus awards.
I would call this more precisely Effective Player RTP, and it is using one specific player's session stats and doing a small formula to extract a percentage value from the wager and profit/loss of the player.
For example, if you wager $1000, and lost $50; you can do (in my method), 1 + (profit / wager) = EPRTP or 1 + (-50 / 1000) = 0.95, or 95% RTP. That may seem easy, but when wager and profit/loss become more complicated, the actual RTP amount can be much more deceptive.
For example, I can go to the Stake reddit, grab the first 'guess my weekly' post I see, and the values they show in their screenshot are:
Week: Wager $328,737, Profit +$25,750. Bonuses: $523. Very good results, and not at all biased towards bonuses. Because Stake in particular reports your total result/profit with your bonuses included, we have to remove that.
For Stake and other websites where they include bonus return as part of your total return: 1 + ((result - bonus) / wager) = EPRTP or 1 + ((25750 - 523) / 328737) = 1.0767... or 107.67% EPRTP.
Definition 5: RTP is the above formula, as related to a player's performance in a single session. Sessions cannot be compared between players without knowing full information and having equal inputs. However, the wager size is totally irrelevant here! It does not matter one bit how big or large any single bet was or wasn't. You can do tiny bets the entire time, and then one big one, and because of the nature of your chance to both win OR lose, RTP will always balance itself out if you do that strategy enough times. You can do many big losses, then one small, but low probability, win, which recovers those losses. It's unfortunate that you didn't get the big win; but technically, RTP was preserved exactly as expected.
That's what makes RTP akin to fate: your actions effectively do not matter aside from the game you choose to play on, because no matter what, if you continue to play, you will meet that RTP average. It is not a matter of 'if' you will lose. It's a matter of 'how long'. Because you don't have to lose to reach that point: you can go even, or even be in profit. And still be negative, and end in loss. Because the slope of the line shown above tilts downwards, and the longer you play, your previous '0' point is now negative your entire balance. And it will find a way back.
How to use RTP to understand and compare your performance
So we have our session-based personal RTP. How do we apply that to a useful statistic that can guide us in future decision-making? Otherwise, there is no point to finding it out at all. The casino can certainly use it to create a profile about your behavior and your usual gameplay practices.
... in progress